Assets: Combine Sensor Data from Multiple Sensors
Assets allow a user to combine sensor data from any sensor readings and apply custom calculations for devices being monitored.
This is useful for creating digital twins or assets with multiple readings from different sensors. Some examples of its versatility include consolidating data from multiple Vutility Hotdrop devices monitoring a three-phase compressor or aggregating data from all the doors in a building by summing up "Total People In" and "Total People Out." The Assets feature works similarly to devices in the platform, enabling you to save asset data, view data history, create dashboards, and send data to your CMMS, building management, and work ticketing systems.
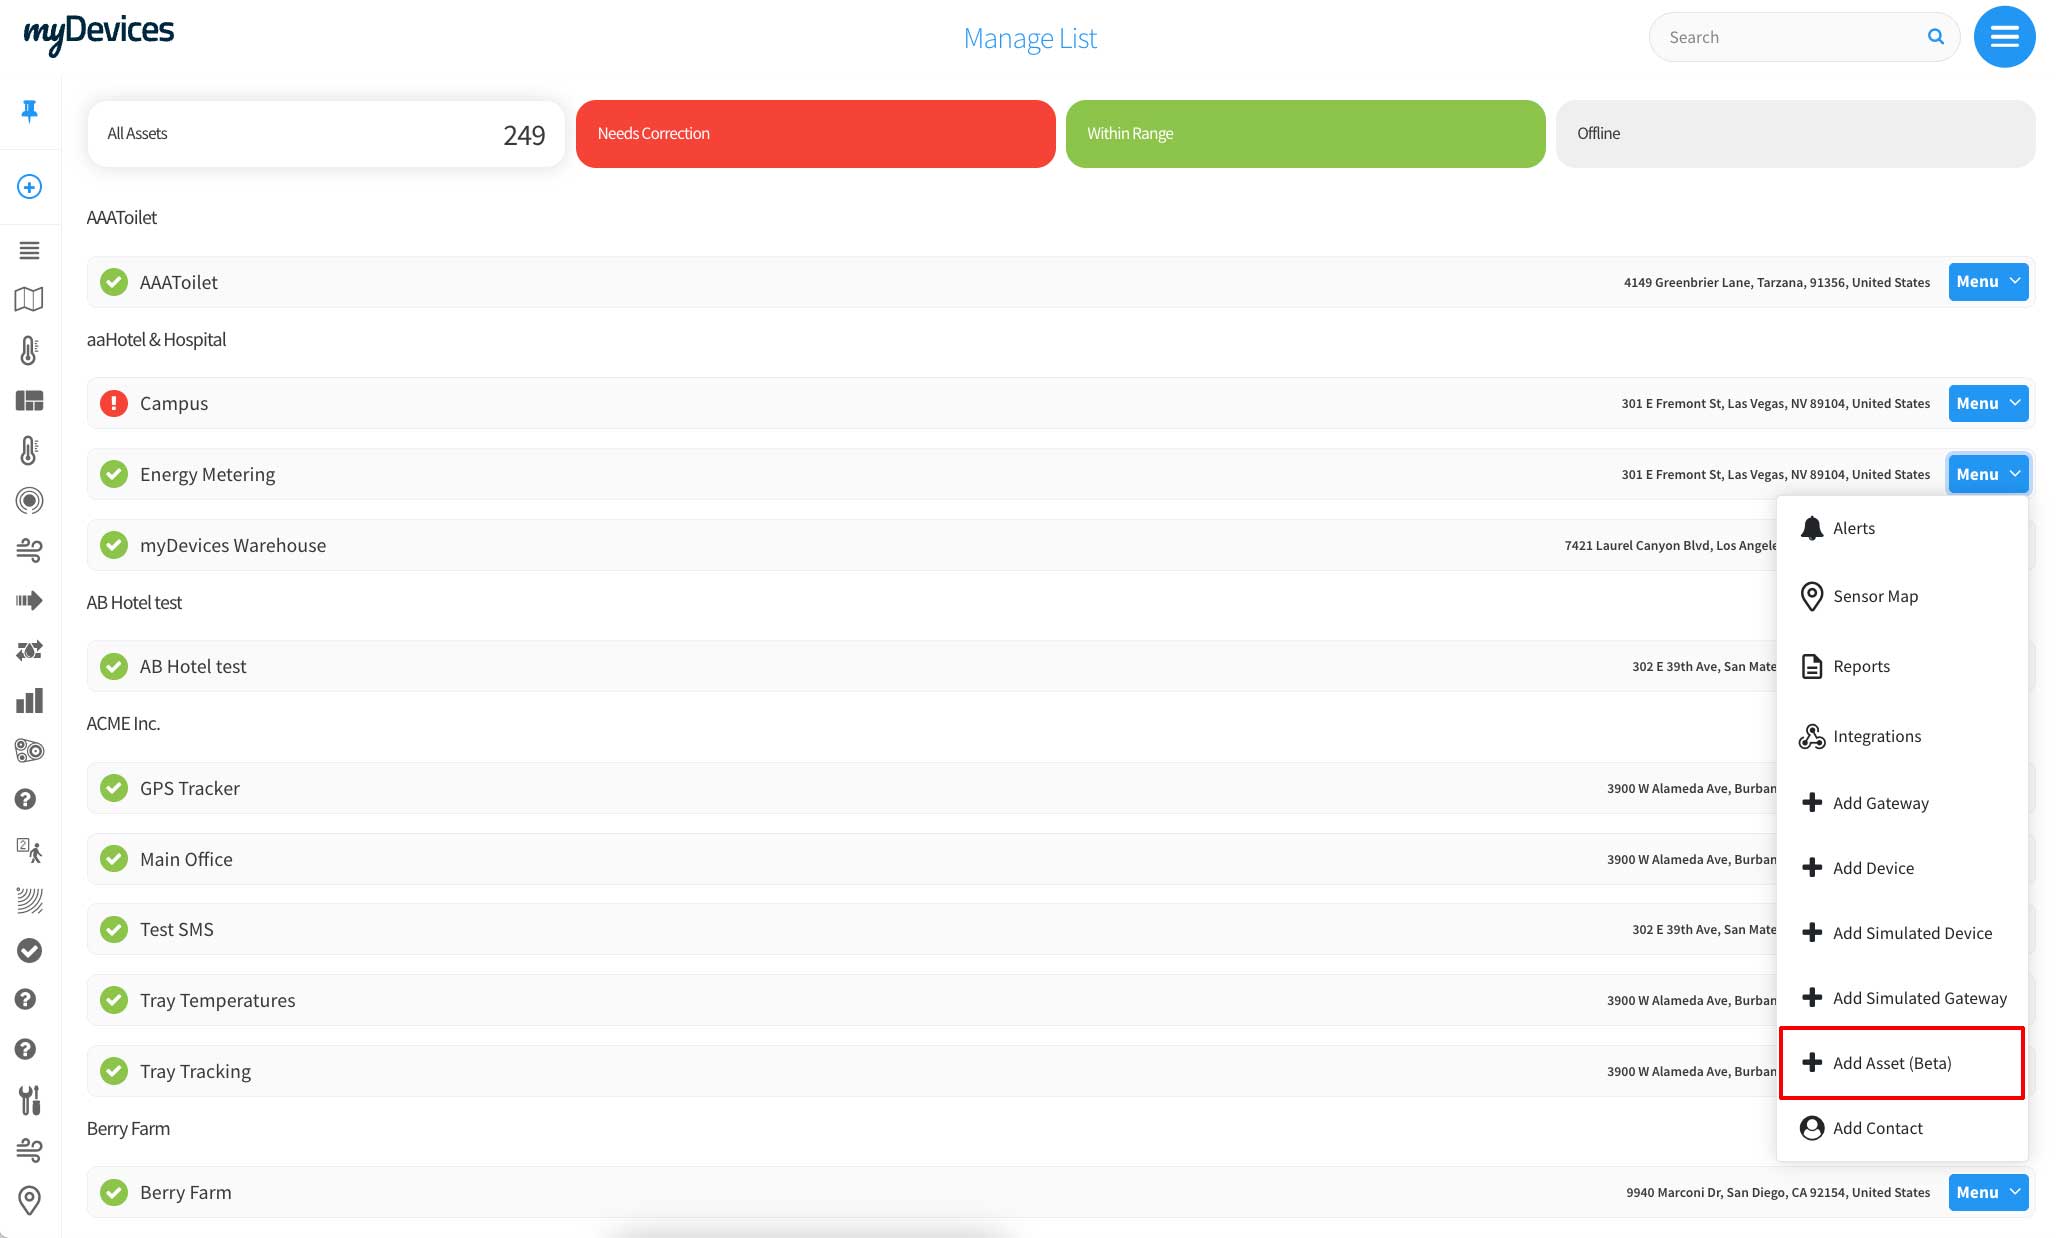
GETTING STARTED
To add an asset, go to the location menu and select Add Assets.
GENERAL INFO FIELDS
Before adding asset data and calculations, fill out General Info about your asset.
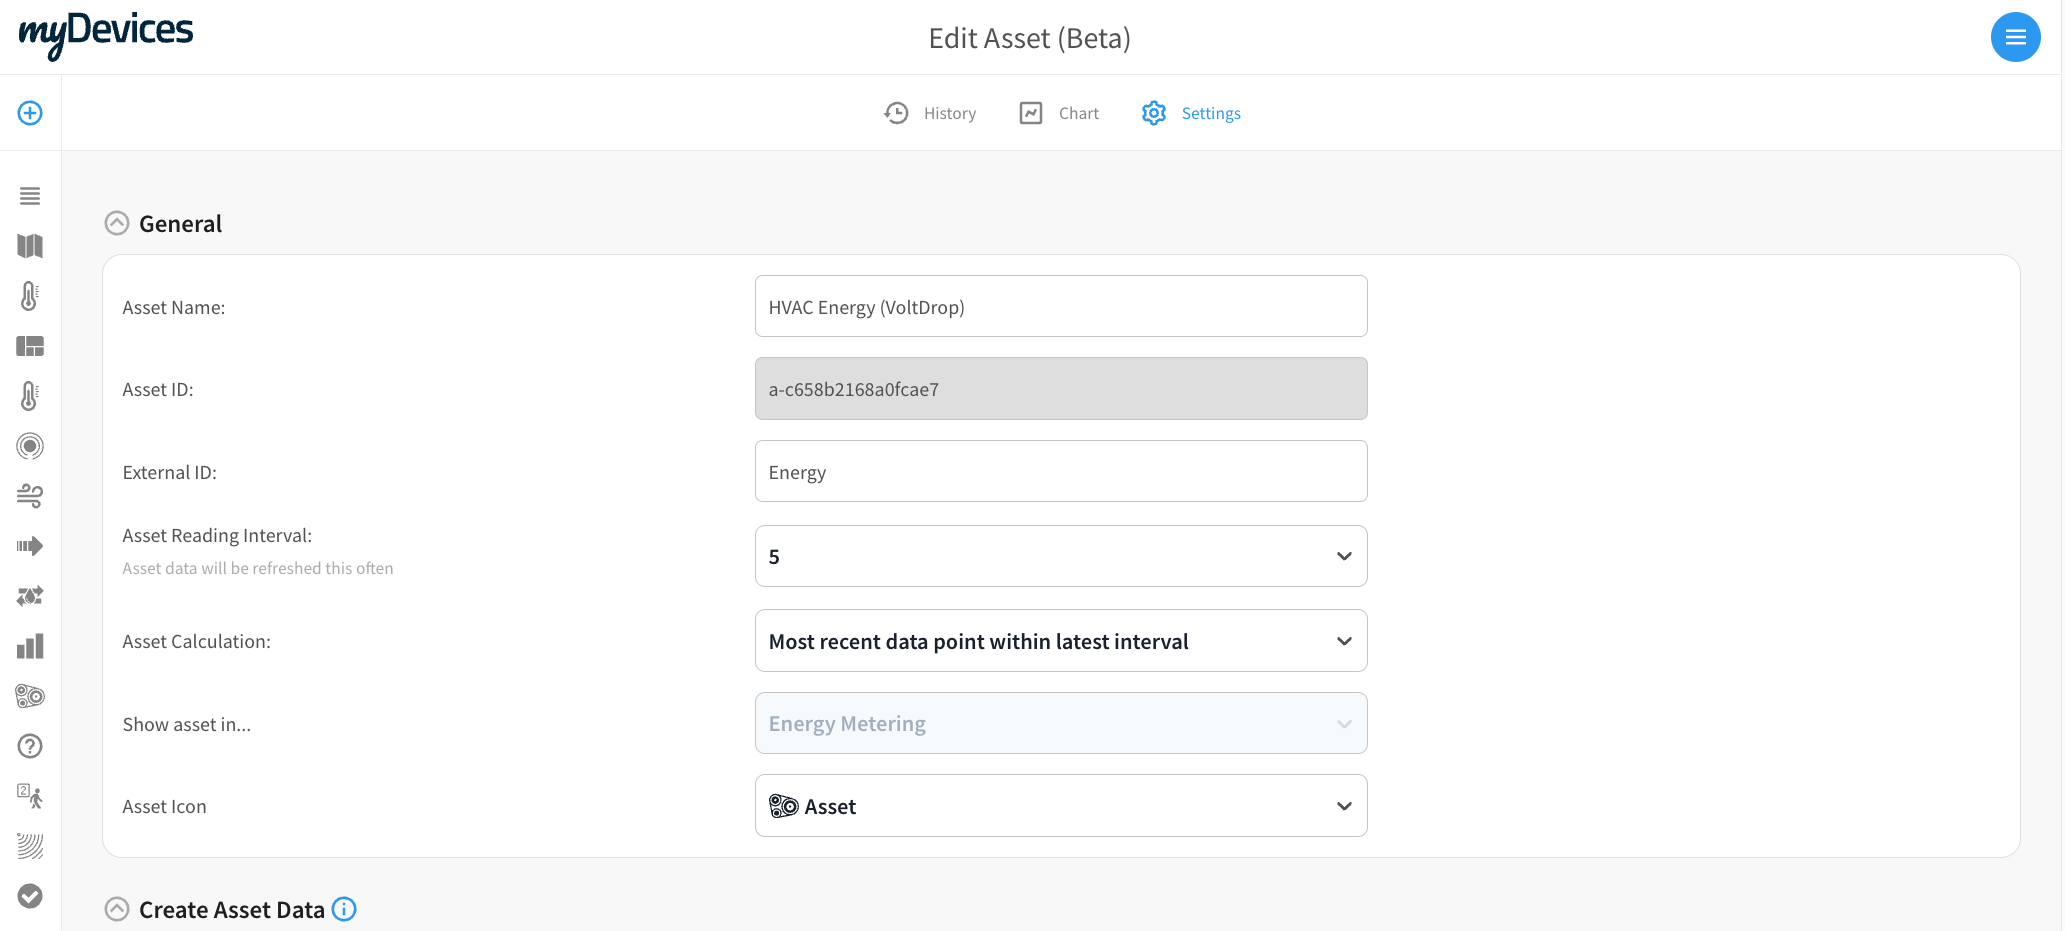
Asset Name: In the General Info section, you’ll first start by giving your asset a name.
Asset ID: The Asset ID is automatically generated upon saving.
External ID: If your asset is represented by an ID from your existing CMMS, building management, and work ticketing systems you can add it here. When data is sent via integrations or pulled via our API, the external ID will ensure you can store the data to be associated properly in your system.
Reading Interval: Every X minutes assets data be calculated Assets data can be received every 5, 15, 30, 45 or 60 minutes.
Asset Calculation: There are 2 ways to calculate data for a reading interval.
Select “All data points within latest interval” and the engine will use all data points that happened to perform the calculations . As an example, you would like to know the Avg Temperature of a Freezer every hour and the Freezer temperature sensors sends data every 15 minutes. By choosing All data points within the interval, our service will take the Avg Temperature for those 4 data points.
Select “All most recent data point within latest interval” and our service will only use the last data point received.
Show asset in: The asset you create will be shown in the Manage screen under 1 location that you choose.
Asset Icon: You will assign your asset an icon. This icon will represent your asset when used in a sensor map or widget.
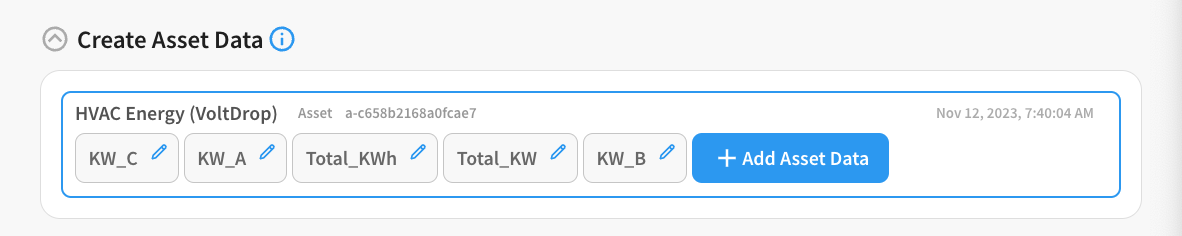
ASSET DATA
After you created your asset, the next step is add asset data and calculations. While your asset can only appear in 1 location, you can add asset data from any device(s) across any location in your account. There are 2 options for add asset data, Simple Data Selection and Advanced Formula Editor.
SIMPLE DATA SELECTION
If you are choose a data point from a device to use as is with no additional calculations or you are just 1 data set then Simple Data Selection is the right approach.
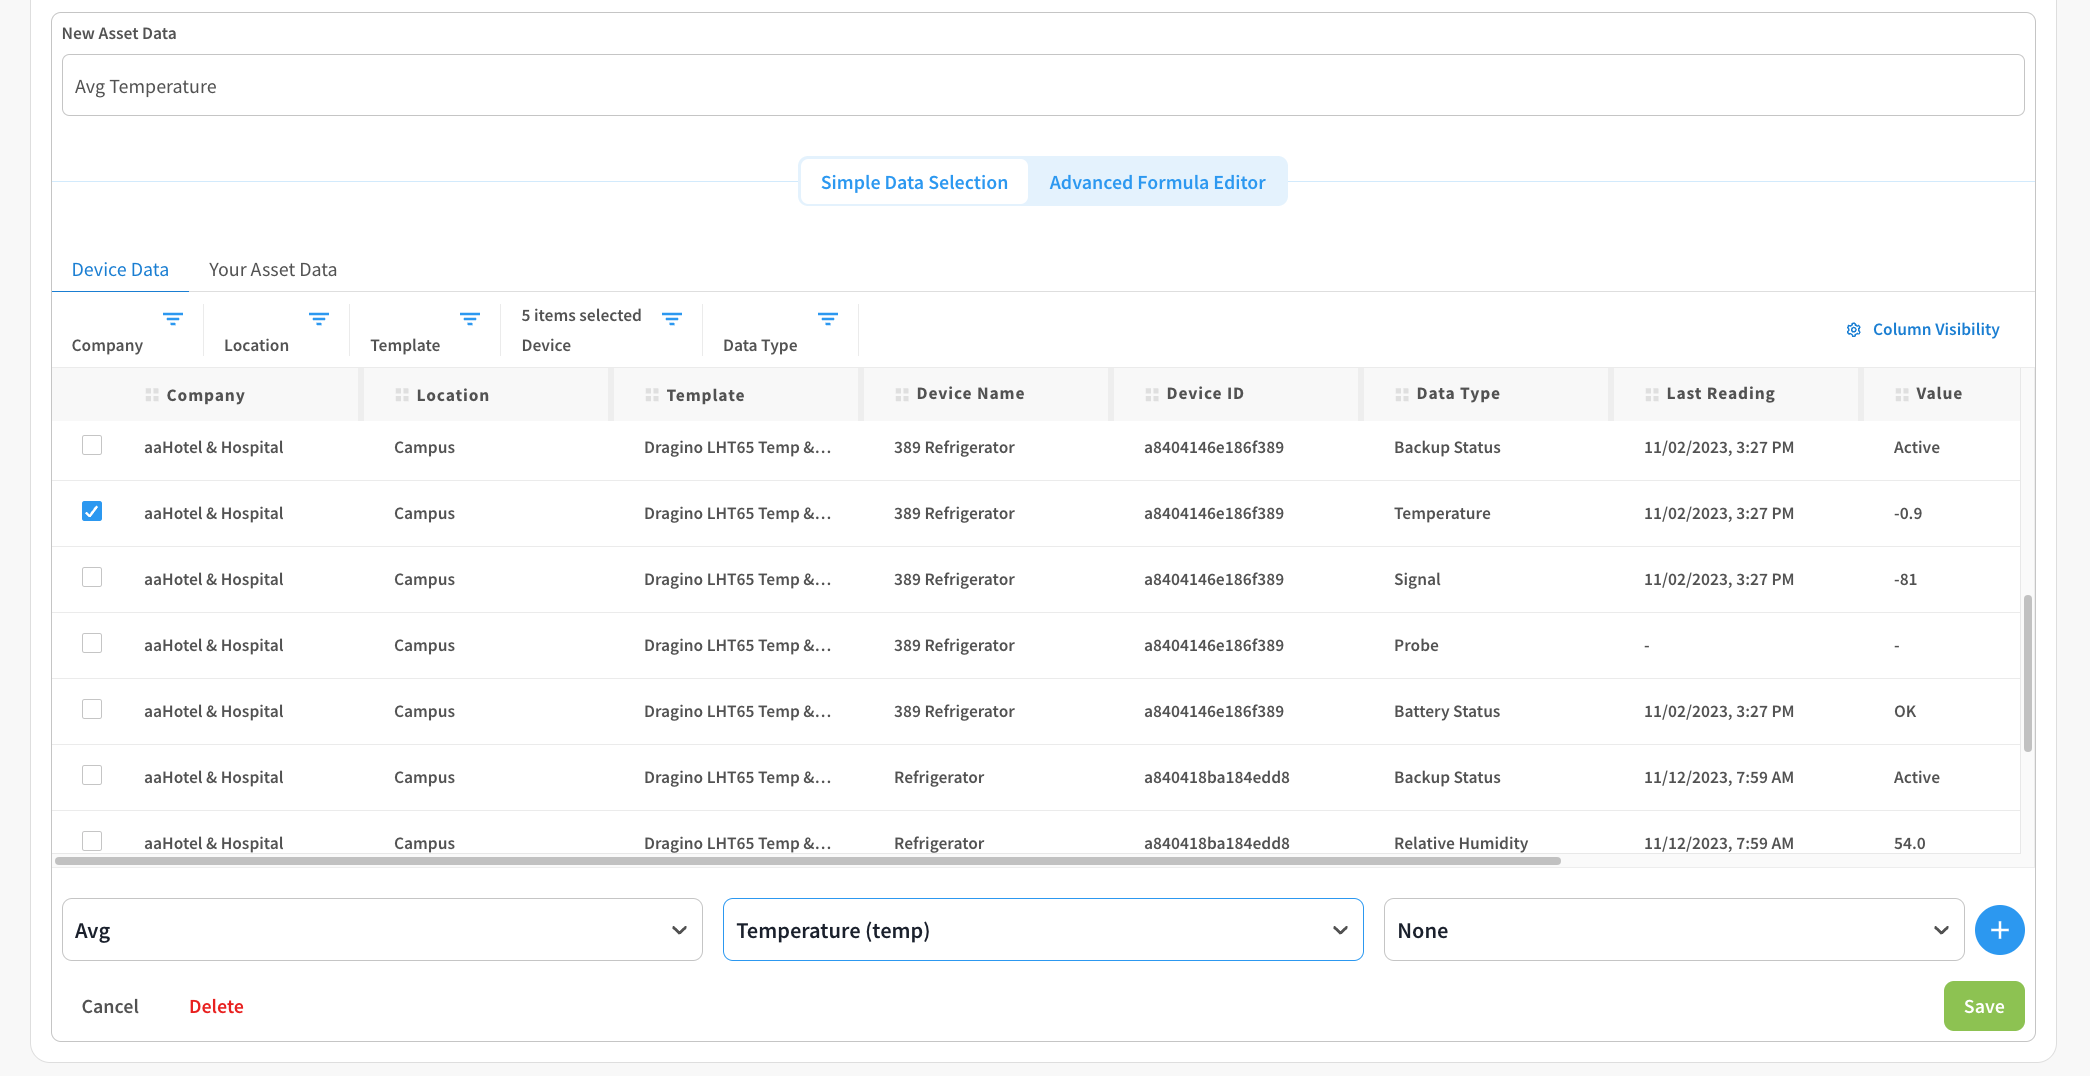
Data Label: Enter the name of the asset data point
Selecting Data: Filter by company, location and device template to select the data points you want to combine or just select 1 data point.
Apply Formula: Apply a formula to your data (SUM, Average, Count, Median, Max or None) or if you only have selected 1 data point choose None
Choose Data Type: After you’ve selected your data and applied a formula, you will select the data type that you want to apply any units of measurement.
Choose Unit of Measurement (if applicable): If you’re adding an asset data point that is a represented as a Value, you will select the unit of measurement. If you’re adding a status data point, you will select None as it not a applicable.
ADVANCED FORMULA EDITOR
If you want to use a custom formula and/or need to use multiple data sets in to calculate your asset data point, you will use the Advanced Formula Editor.
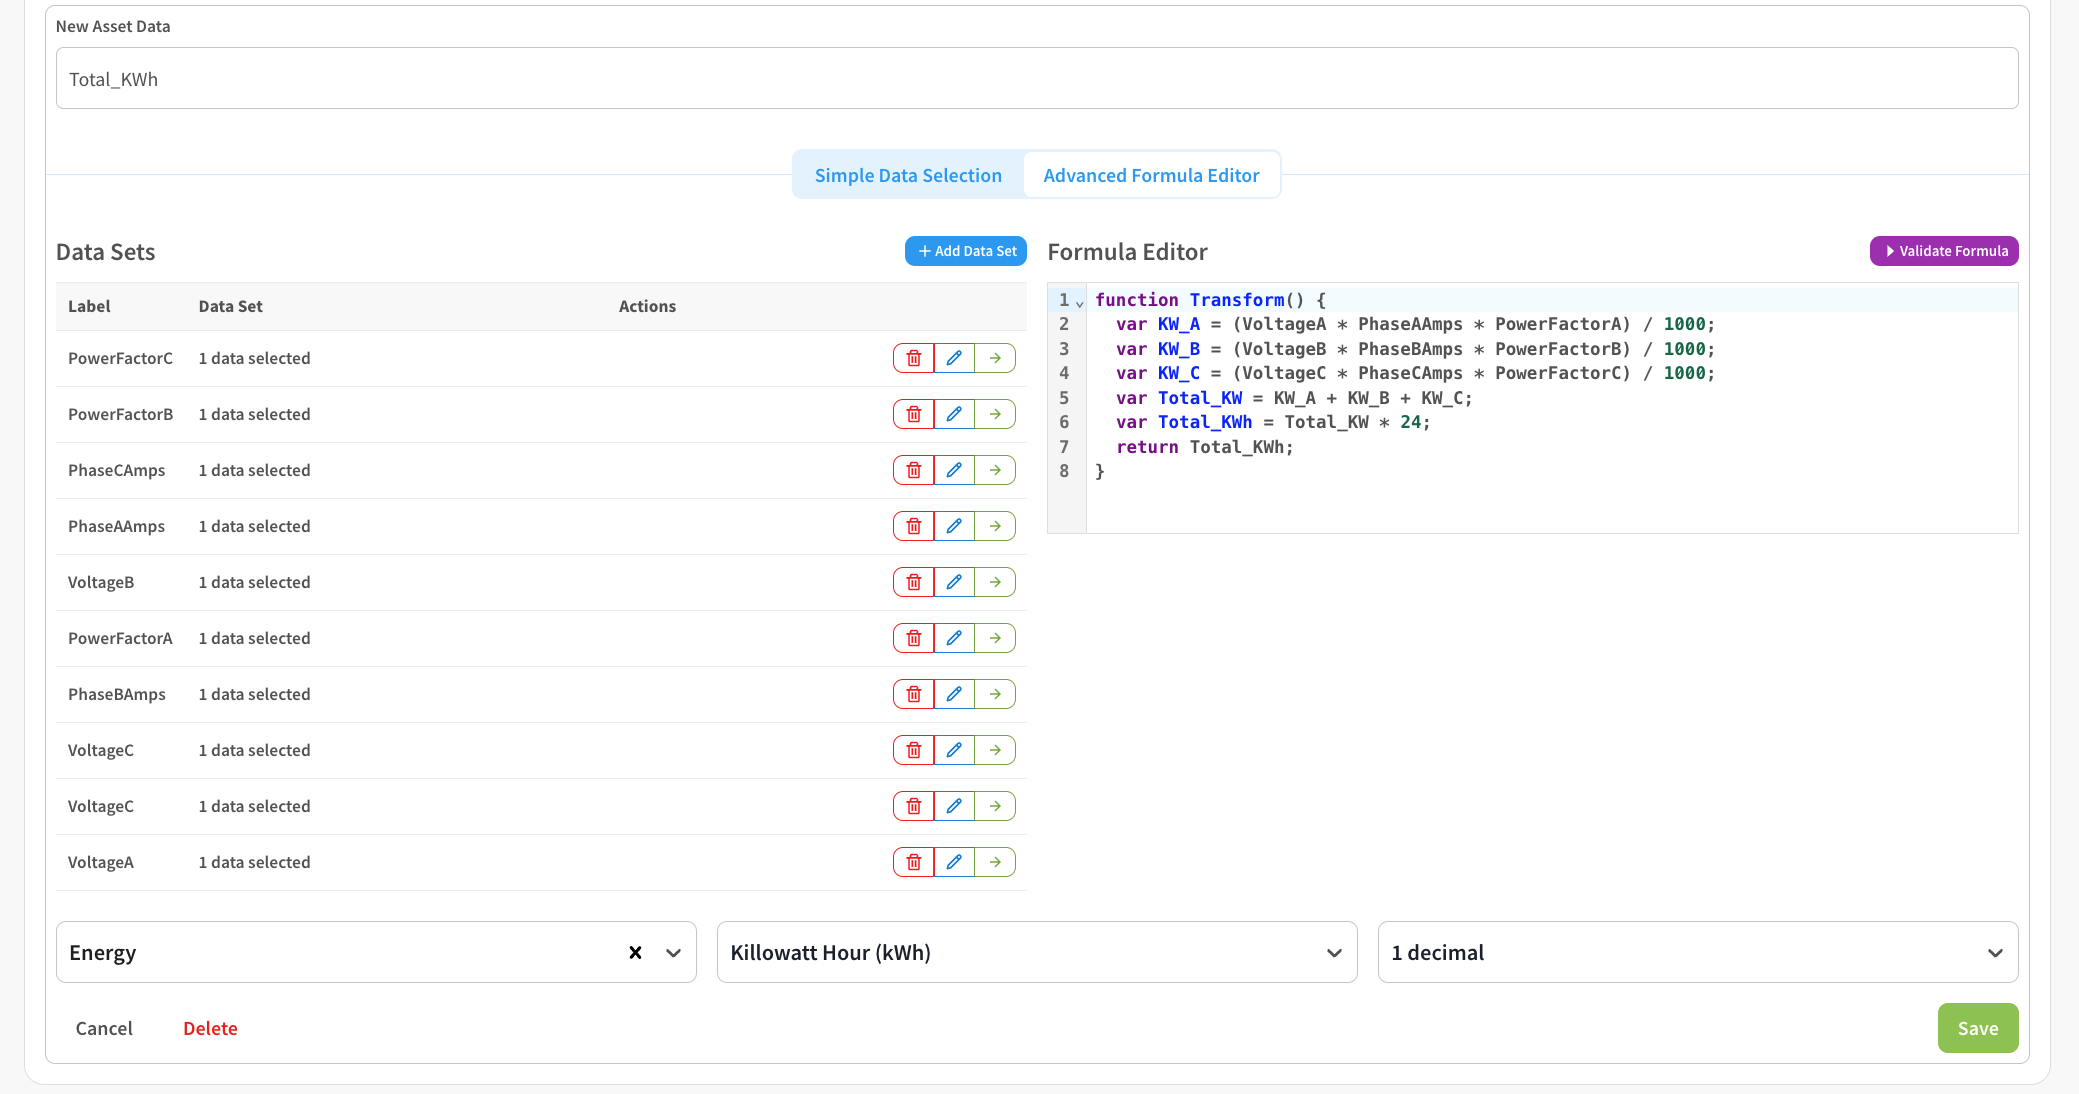
Data Label: Enter the name of the asset data point
Selecting Multiple Data Sets: With Advanced Formula Editor, you can create 1 or more data sets for an asset that can be used to calculate your assets data.
Creating Formulas using native javascript code: Our asset services uses standard JS code to process formulas and calculated data points. Some JS examples of its versatility include consolidating data from multiple Vutility Hotdrop devices monitoring a three-phase compressor or aggregating data from all the doors in a building by summing up "Total People In" and "Total Pe
JS Code Example 1: Occupancy: SUM (Total In) - (SUM) Total Out
function Transform() {
  return FrontDoorPeopleIn + BackDoorPeopleIn - FrontDoorPeopleOut - BackDoorPeopleOut
}
JS Code Example 2: Energy (KWH)
function Transform() {
  var KW_A = (VoltageA * PhaseAAmps * PowerFactorA) / 1000;
  var KW_B = (VoltageB * PhaseBAmps * PowerFactorB) / 1000;
  var KW_C = (VoltageC * PhaseCAmps * PowerFactorC) / 1000;
  var Total_KW = KW_A + KW_B + KW_C;
  var Total_KWh = Total_KW * 24;
  return Total_KWh;
}
JS Code Example 3: Determining Device Online Status from Multiple Sensors
function Transform() {
    // Check if either device is "On"
    if (Waterjet1 === 1 || Waterjet2 === 1) {
        return 1;
    }
    // If both are "Off"
    else if (Waterjet1 === 0 && Waterjet2 === 0) {
        return 0;
    }
}
Choose Data Type: After you’ve selected your data and applied a formula, you will select the data type that you want to apply any units of measurement.
Choose Unit of Measurement (if applicable): If you’re adding an asset data point that is a represented as a Value, you will select the unit of measurement. If you’re adding a status data point, you will select None as it not a applicable.
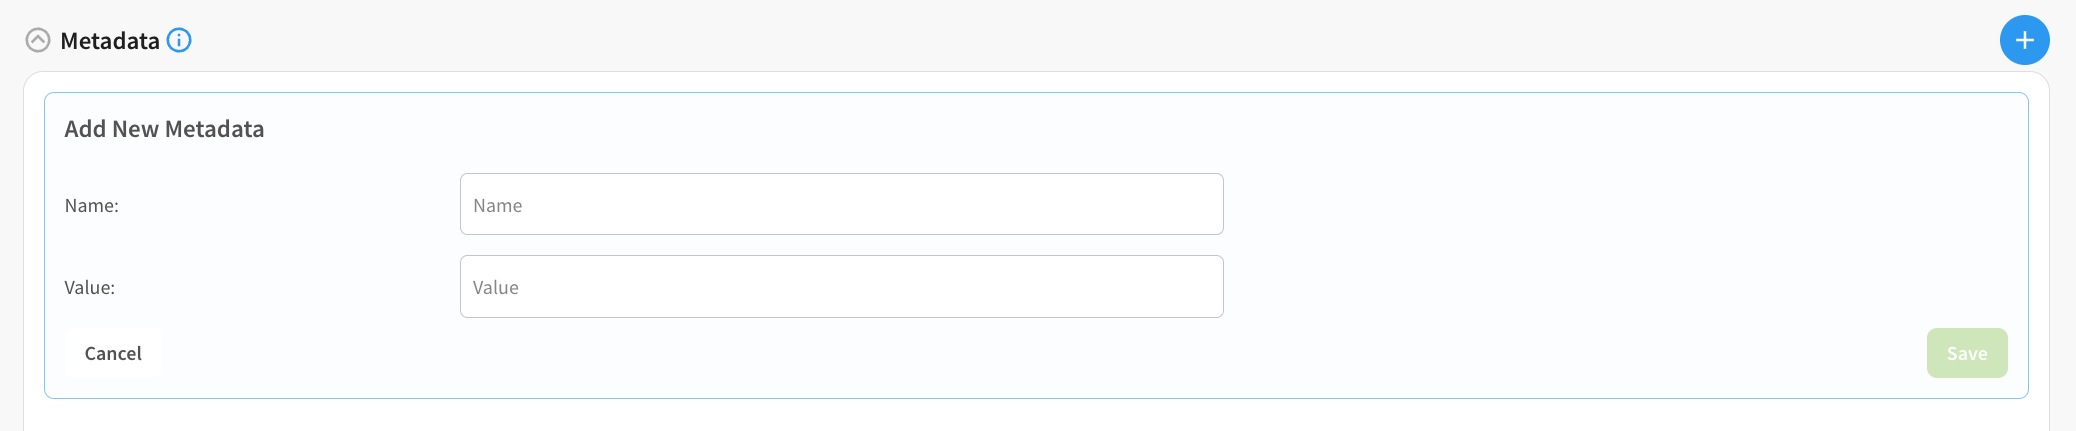
META DATA
With each asset you can store unlimited amount of meta data related to the asset that you’re monitoring or updated